Project One, CS 257

Due before noon Tuesday November 25, 1997
I will contend that conceptual integrity is the most important consideration in system design.
-Frederick Brooks, Jr.
The Mythical Man Month


Note: you may work in teams on this project. But I expect all members of the team to contribute. And, to earn the same grade, a larger team must produce a better program.
This project is to implement a ``graphing calculator.'' We will not be concerned with the user interface, but with constructing expressions, taking their derivatives, and making nice looking plots.

You will find the functions defined in Problem Set 6 helpful. You may begin with either your own definitions, or with the solutions posted.

  1. Extend expr2 and simplify to deal with the unary functions sin, cos, exp and log. (Remember, in Scheme log is the natural log.)

  2. Define diff which takes two arguments: an arithmetic expression and a symbol, and returns the symbolic derivative of the expression with respect to the given variable. This includes expressions involving the functions listed above.

    To refresh your memory, these are the rules of derivatives. These are sufficient, when diligently applied, to take the derivative of any arithmetic expression.

    (d/dx)x = 1
    (d/dx)y = 0 (y a variable other than x, or a number)
    (d/dx)(A+B) = (d/dx)A + (d/dx)B
    (d/dx)(A-B) = (d/dx)A - (d/dx)B
    (d/dx)(A*B) = A (d/dx)B + B (d/dx)A
    (d/dx)(A/B) = (B (d/dx)A - A (d/dx)B)/(B*B)
    (d/dx)(f(A)) = f'(A) (d/dx)A
    where A and B are potentially complex arithmetic operations, f is a function, and f' is it's derivative (eg sin'(x) = cos(x), cos'(x)=-sin(x), exp'(x)=exp(x), log'(x)=1/x).

    Examples:

    (diff 57 'x)                   ; 0
    (diff 'a 'x)                   ; 0
    (diff '(+ a b) 'x)             ; 0
    (diff 'x 'x)                   ; 1
    (diff '(* a (* x x)) 'x)       ; (* a (* 2 x))
    (diff '(/ x a) 'x)             ; (/ 1 a)
    (diff '(/ a x) 'x)             ; (* a (/ -1 (* x x)))
    (diff '(+ a (* x x)) 'x)       ; (* 2 x)
    (diff '(* (+ x 1) (+ x 2)) 'x) ; (+ (+ x 2) (+ x 1))
    (diff '(* a (sin (* b x))) 'x) ; (* a (* b (cos (* b x))))
    
    (or different but equivalent results.)

  3. Define a plotting routine.

    (plot expr var n-samples x0 x1 xtics y0 y1 ytics) draws (using the turtle) a plot of the expression expr as a function of the variable var. The variable var ranges from x0 to x1, and the y-axis ranges from y0 to y1. The expression is evalutated at n-samples equally spaced points along the x-axis. The x-axis is has numbers at both the upper and lower ends of its range, and also at equally spaced intermediate points, to make a total of xtics numbers. The y-axis is similarly numbered. Both the x- and y-axes are also labeled, with var and a simplified version of expr, respectively.

    So if you type (plot '(+ (+ 1 4) (* (* t 1) t)) 't 30 -1 1 5 5 6 6) you end up with something like this:
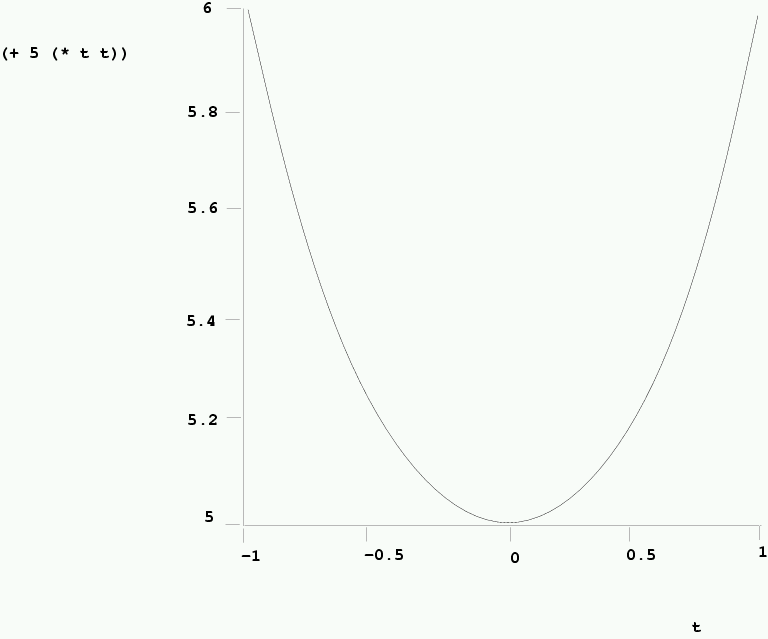
    The plot should be drawn relative to the where the turtle is when you call plot, so it will be possible for the user to draw a couple plots next to each other if they so desire. And after drawing a plot, the turtle should end up at a location such that the user can immediately draw another plot without obscuring the first plot. Note: the variables turtle-x and turtle-y give the current location of the turtle. Although not essential, they may be helpful in making your plots relative to the starting location of the turtle.

    It's okay if the curve extends below y0 or above y1, but you get extra credit for clipping it at those boundaries.

    Examples:

    (define f '(* (exp (- 0 s)) (sin (* 20 s))))
    (plot f 's 30   0 4 5   -1 1 3)
    (plot (diff f 's) 's 30   0 4 5   -10 10 3)
    (plot (diff (diff f 's) 's) 's 30   0 4 5   -20 20 3)
    

  4. Extra credit: add some interesting features, of your choice. Some ideas: plot a 3D surface like (/ (* (sin x) (cos y)) (+ 0.01 (+ (* x x) (* y y)))) as a function of both x and y. Plot more than one curve on the same set of axes, with different x-axis ranges for the different curves - which should be displayed with different turtle pen colors. Plot a bunch of curves of f(x,z) as a function of z, for a set of different values of z, with each curve labeled in place with the value of z it corresponds to.

    Run wild.

Turn in this problem set by running the program ~barak/bin/submit file.scm sample.scm sample.ps where file.scm is your source code, sample.scm are some scheme commands that, when loaded in on top of your source code, demonstrate the functionality of your calculator; and sample.ps is a postscript dump of the state of the turtle graphics window, so we can look at it.

The .scm files should be legal scheme code that load into a fresh stk without any errors

You are allowed to make corrections, because the last submit command supersedes all previous submissions.


Barak Pearlmutter <bap@cs.unm.edu>